Access Bank customers using the mobile app find it difficult to track and manage their expenses.
The current UI lacks a smart expense categorization system, making it challenging for users to understand where their money is going.
Why It’s a Problem
Users must manually check transaction histories to analyze their spending.
No visual breakdown of expenses by category (e.g., food, transportation, shopping).
Competitor apps (e.g., Kuda, Opay) offer better financial tracking tools.
Many users rely on third-party budgeting apps, reducing engagement with Access Bank’s app.
Challenge
Here are some key impacts:
Keeping the interface clean while adding a new feature.
Ensuring expense categorization is accurate and automatic.
Encouraging users to adopt the new feature instead of external apps.
The Current App design


Possible Solutions:
Smart Expense Categorization: Automatically classifies transactions into categories like Food, Transport, Utilities, etc.
Budgeting Feature: Allows users to set monthly spending limits for each category.
Visual Dashboard: Introduces charts and graphs for easy financial insights.
Why We Chose Smart Expense Categorization
Automation & Simplicity: Users don’t need to manually label transactions.
Competitive Edge: Helps Access Bank compete with digital-first fintech apps.
Scalability: Can be enhanced with AI for personalized spending insights.
The Idea: A Smart Expense Categorization
Help users track and manage spending efficiently

Home Screen
✅ Clicks on “Transaction History”
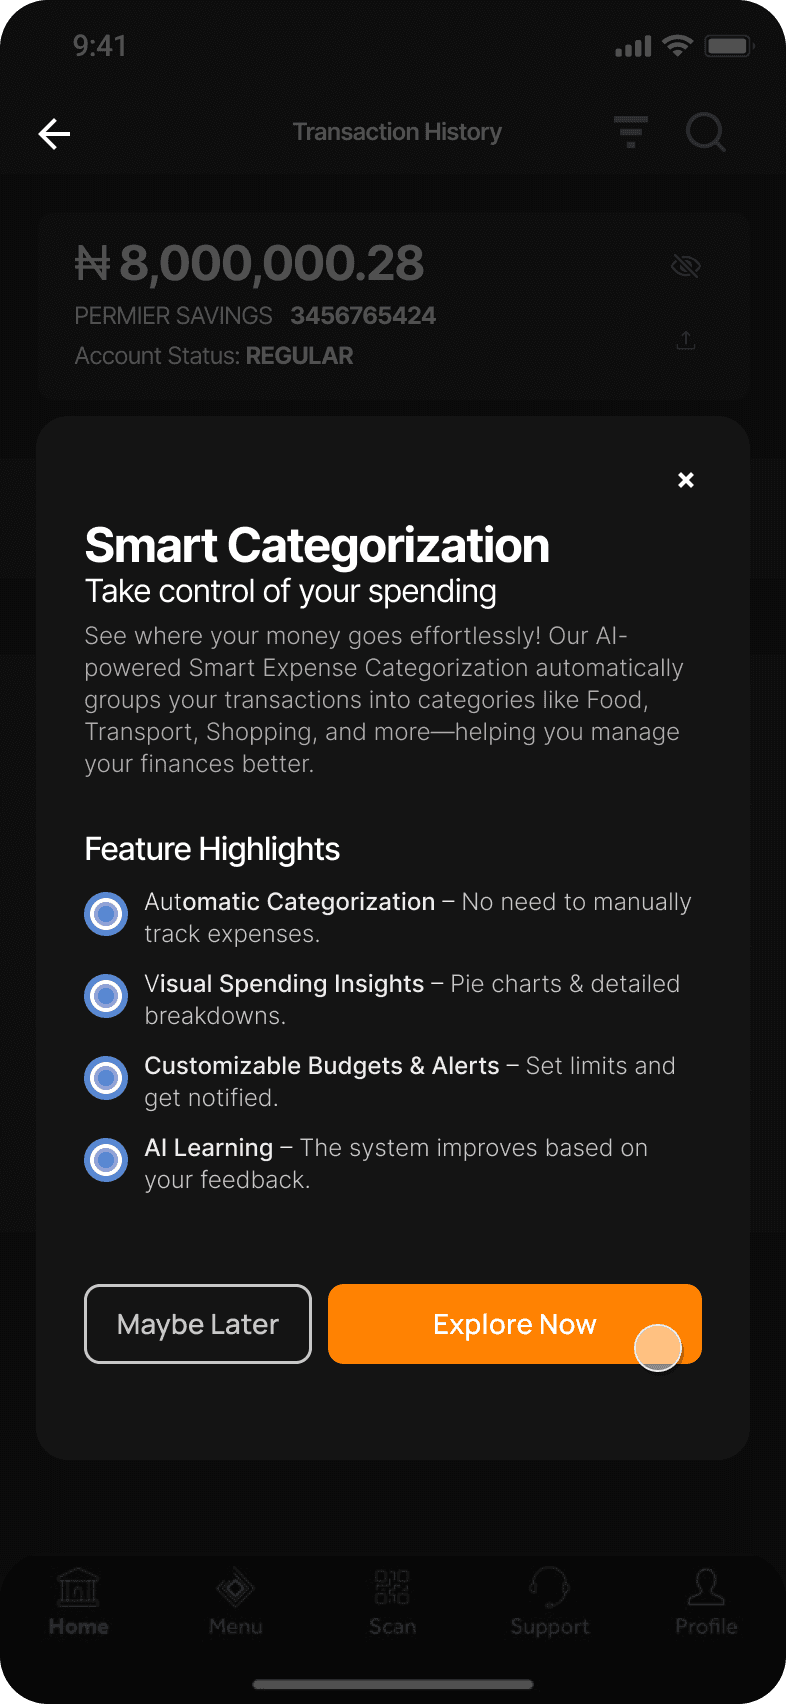
Discover Smart Categorization
✅ On the Transactions History Page a Modal pop-up
✅ Introducing the feature
✅ Clicks "Explore Now."

Navigating to Smart Categorization
✅ An icon directs you to the filter icon—click on it
✅ Filter Card, Click on the (Yellow Icon). Smart Expense Categorization Displayed


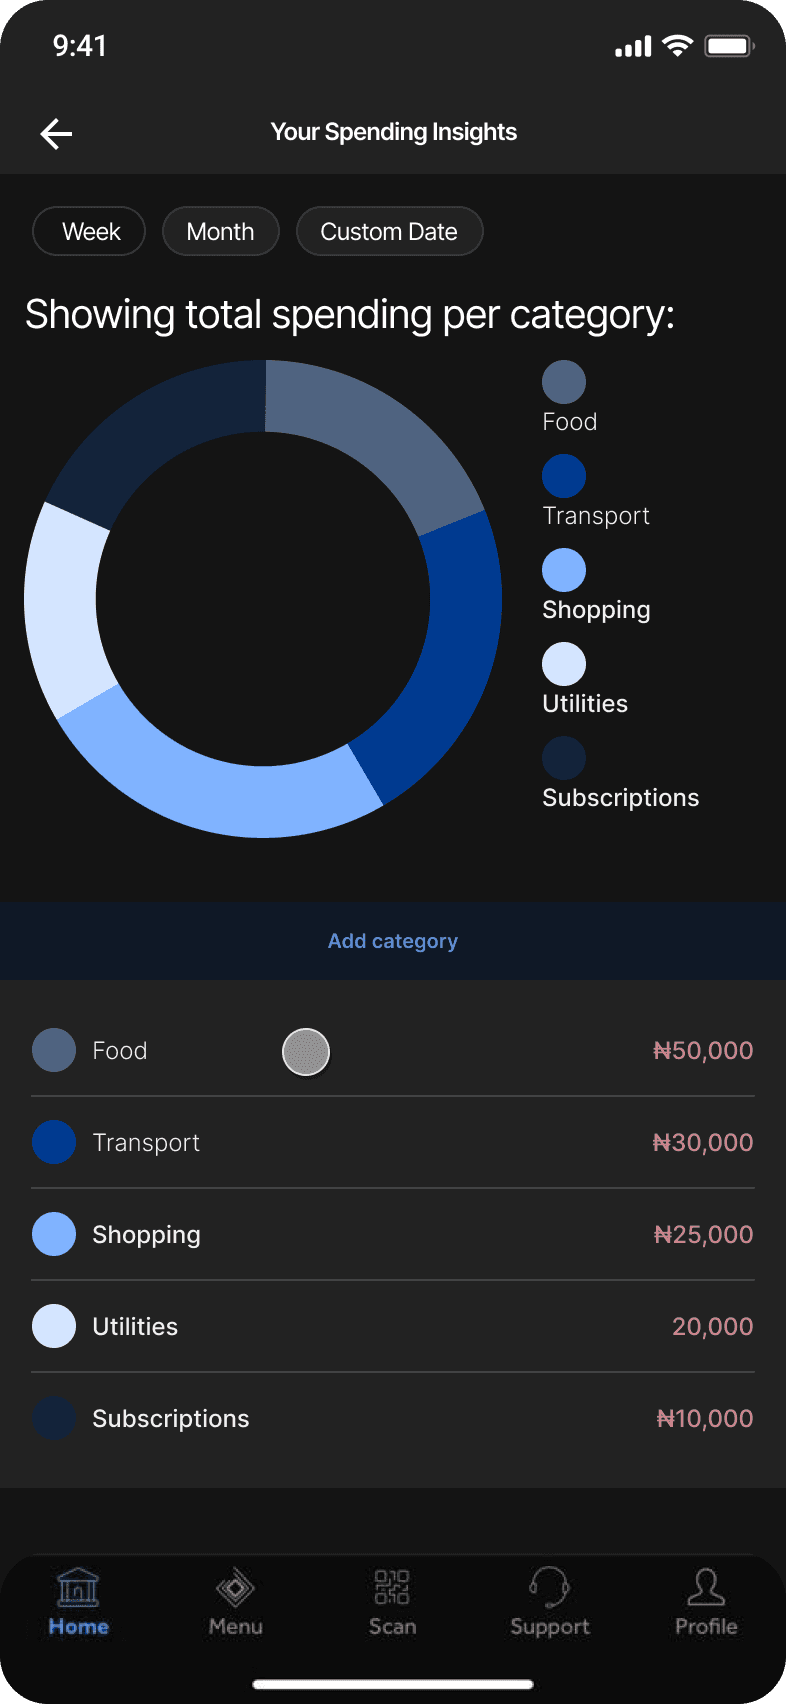
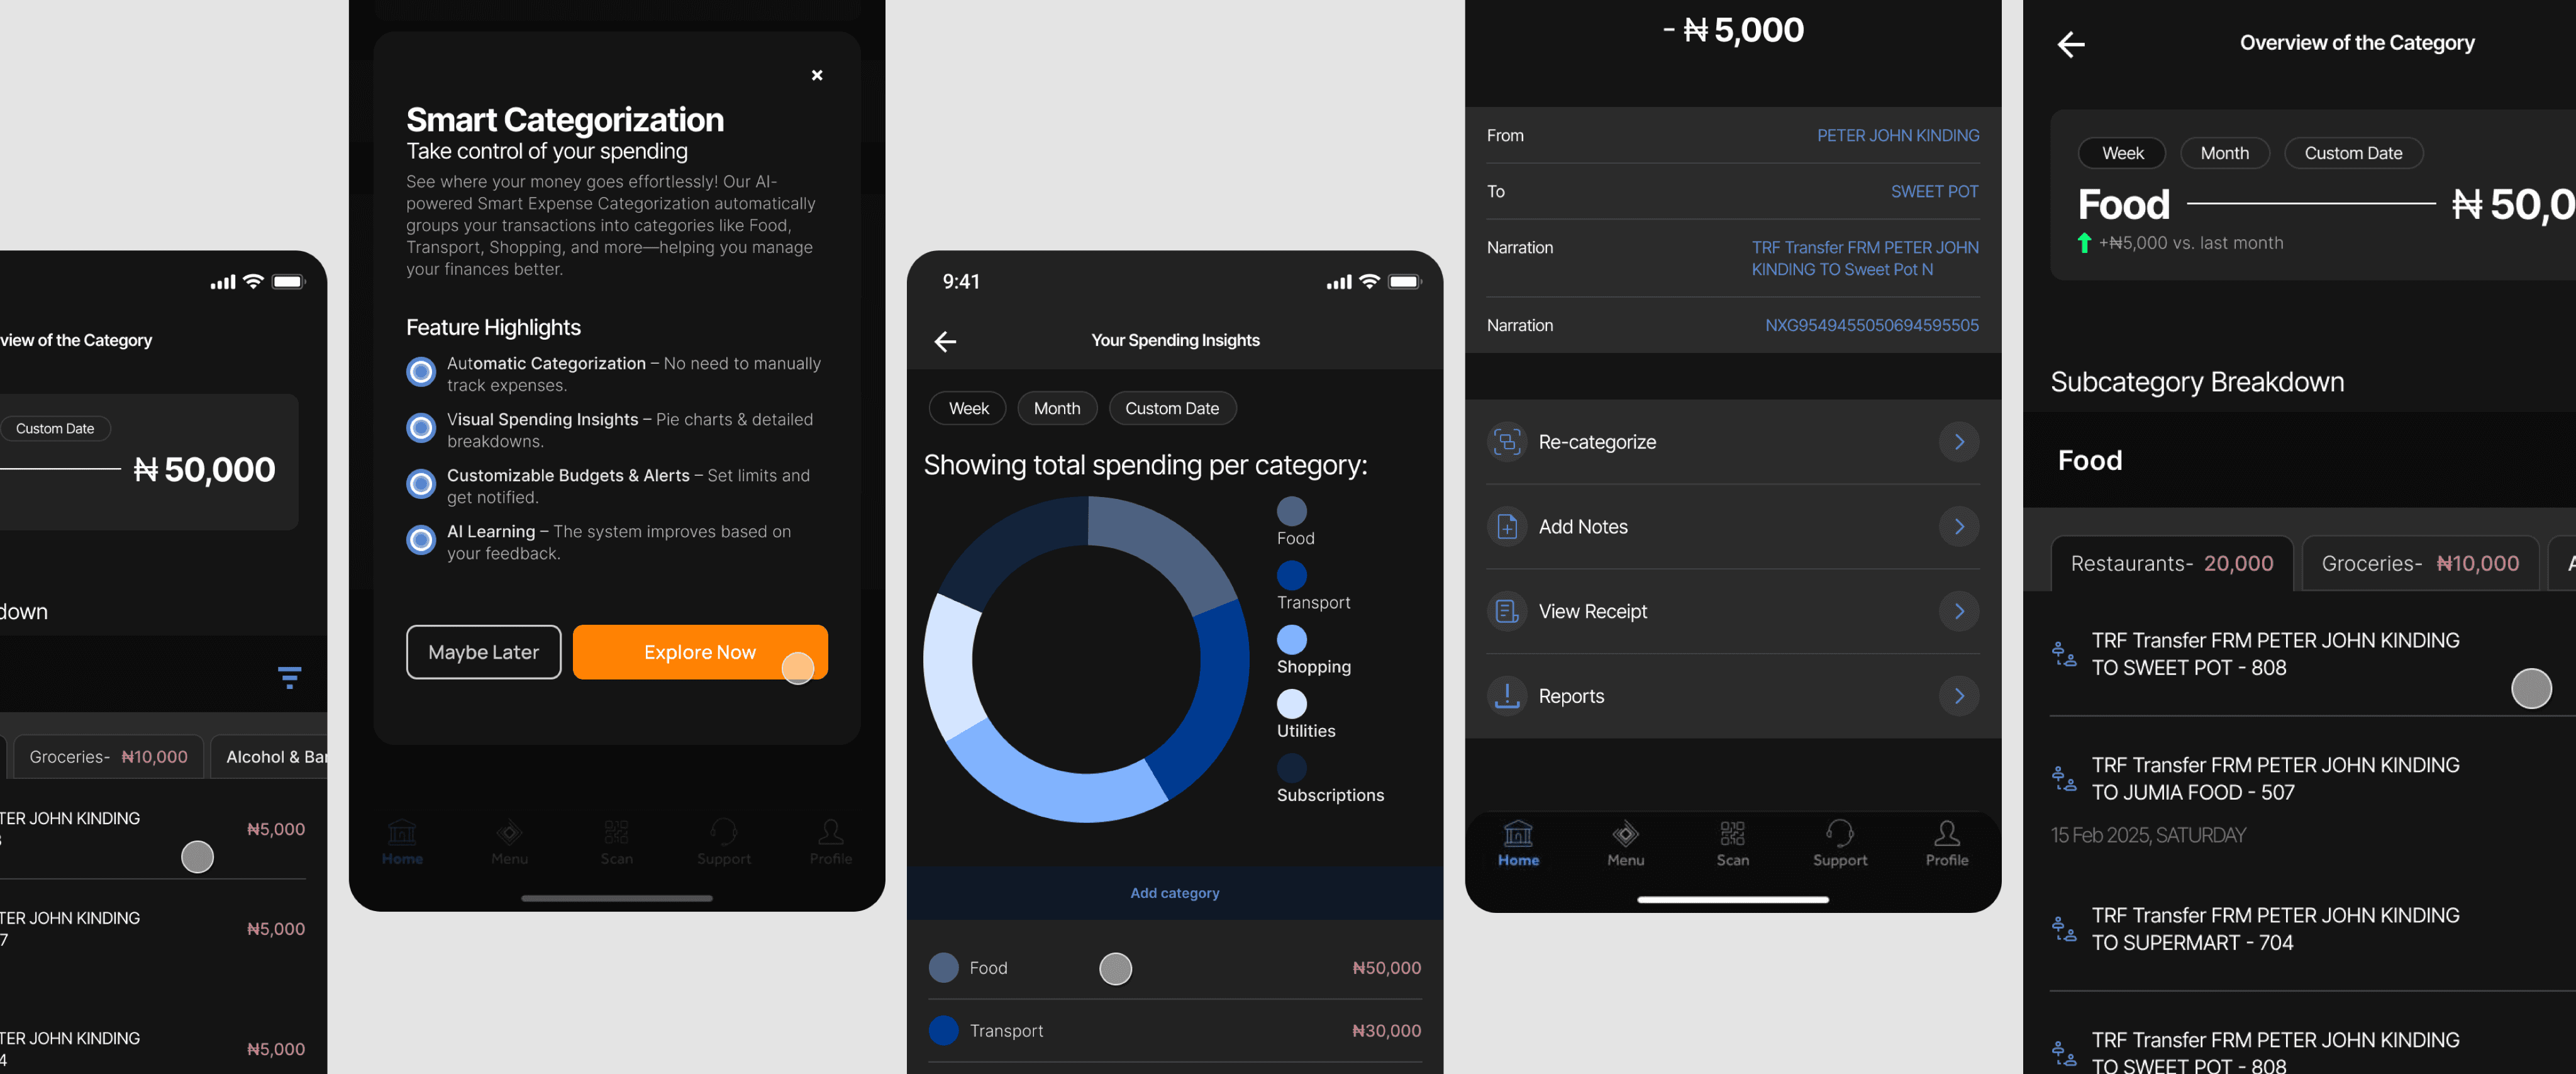
View Expense Breakdown
✅ Pie Chart: Displays total spending categorized
✅ List View of Transactions: Each category expands to show individual transactions.
✅ Sort by week, month, or custom date range


Category Details & Transactions
✅ User Sees:
Breakdown into subcategories:
Restaurants – ₦20,000
Groceries – ₦10,000
Coffee & Snacks – ₦5,000
✅ View list of transactions with date, merchant & payment method
✅ Tap a transaction → View details, re-categorize, or add notes


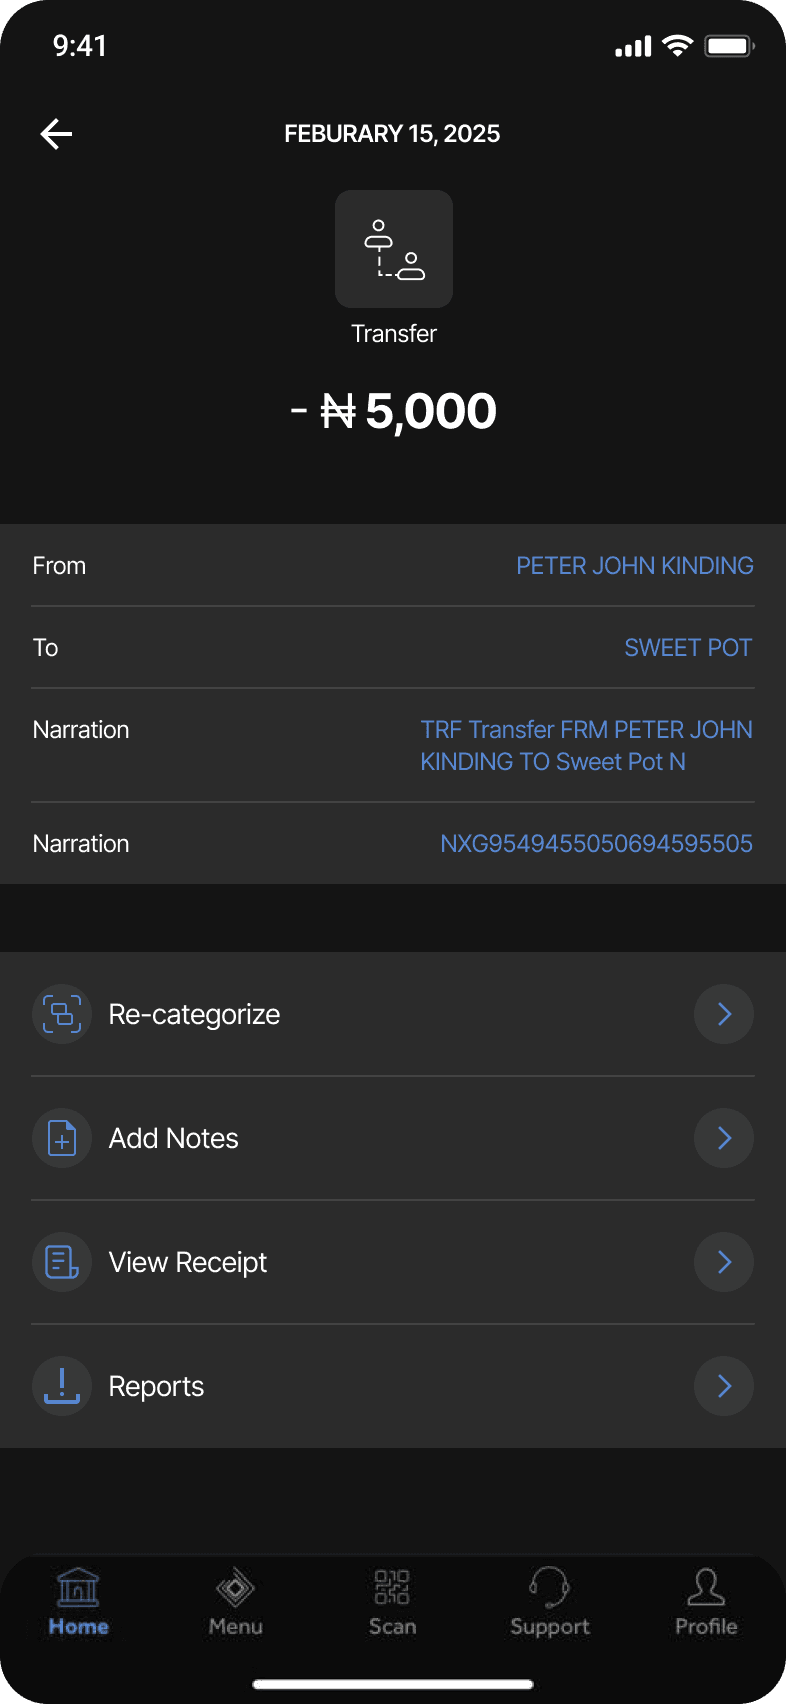
Adjust & Give Feedback
✅ User Can:
Takeaways
Projected Outcome:
Users gain better financial awareness, improving their money management.
Reduced churn as customers rely more on the Access Bank app for budgeting.
Increased engagement, leading to higher usage of other banking services.
KPIs (Key Performance Indicators):
Feature Adoption Rate: Percentage of users utilizing the categorization tool.
Feature Adoption Rate: Percentage of users utilizing the categorization tool.
Engagement Rate: Track how often users check their spending insights.
Customer Feedback: Reviews and ratings mentioning the new feature.
Explore More Work

Get in Touch